Memory causes more unnecessary panic than almost anything else in SQL Server. Someone notices SQL Server is using 90% of the server’s RAM, raises an alarm, and before long someone is restarting services or ordering more RAM without understanding what’s actually happening.
Most of the time it’s not a problem. Sometimes it is.
How SQL Server uses memory
SQL Server is designed to use as much memory as you give it. It caches data pages in the buffer pool so it doesn’t have to read from disk on every query. More memory means more data cached, which means faster queries.
The engine manages memory dynamically — it grows up to the max server memory setting and should release memory back to the OS under pressure. In practice, this doesn’t always happen cleanly.
Memory pressure occurs when SQL Server can’t get the memory it needs, or the OS starts reclaiming it faster than SQL can adapt. The result is excessive disk reads, query timeouts, and a server that feels like it’s wading through treacle.
How to tell if you actually have a problem
Before running any scripts, check the error log. SQL Server writes warnings when it’s under serious memory pressure:
-- Check error log for memory warnings
EXEC sp_readerrorlog 0, 1, 'memory';SQL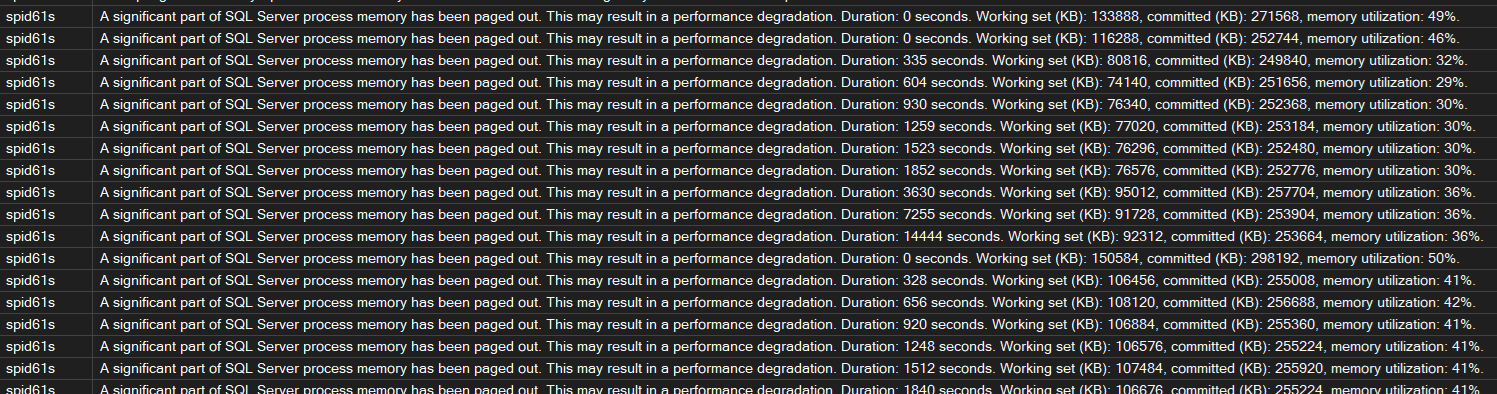
Look for “insufficient memory” or “A significant part of sql server process memory has been paged out”. That second one is serious — the OS has started paging SQL Server memory to disk.
Page Life Expectancy
PLE is the number of seconds a page can be expected to stay in the buffer pool without being touched. A sudden drop matters more than the absolute value.
The old rule of thumb was PLE above 300. That was written when 4GB of RAM was generous. On a modern server with 256GB, PLE should be in the thousands. If yours is normally 8000 and drops to 500, that’s worth investigating.
-- Page Life Expectancy per NUMA node
SELECT
    object_name,
    counter_name,
    instance_name,
    cntr_value AS ple_seconds
FROM sys.dm_os_performance_counters
WHERE counter_name = 'Page life expectancy'
  AND object_name LIKE '%Buffer Manager%'
   OR object_name LIKE '%Buffer Node%'
ORDER BY object_name;SQL
Memory waits
-- Memory-related waits
SELECT
    wait_type,
    waiting_tasks_count,
    wait_time_ms,
    max_wait_time_ms,
    CAST(wait_time_ms * 1.0 / NULLIF(waiting_tasks_count, 0) AS DECIMAL(10,2)) AS avg_wait_ms
FROM sys.dm_os_wait_stats
WHERE wait_type IN (
    'RESOURCE_SEMAPHORE',
    'RESOURCE_SEMAPHORE_QUERY_COMPILE',
    'CMEMTHREAD',
    'SOS_VIRTUALMEMORY_LOW',
    'PAGEIOLATCH_SH',
    'PAGEIOLATCH_EX'
)
  AND waiting_tasks_count > 0
ORDER BY wait_time_ms DESC;SQL| Wait type | What it means |
|---|---|
RESOURCE_SEMAPHORE | Queries waiting for a memory grant to execute |
RESOURCE_SEMAPHORE_QUERY_COMPILE | Compilation waiting for memory — often plan cache pressure |
CMEMTHREAD | Contention on memory allocation structures |
SOS_VIRTUALMEMORY_LOW | SQL Server is critically low on virtual memory |
PAGEIOLATCH_SH/EX | Waiting on data pages to be read from disk — often a symptom of low PLE |

High RESOURCE_SEMAPHORE waits mean queries are queuing for memory grants. This is where
large sorts, hashes, and spills start causing real problems.
Who is consuming memory right now
-- Memory consumers by clerk type
SELECT
    type,
    name,
    SUM(pages_kb) / 1024 AS memory_mb
FROM sys.dm_os_memory_clerks
WHERE pages_kb > 0
GROUP BY type, name
ORDER BY memory_mb DESC;SQL
MEMORYCLERK_SQLBUFFERPOOL will be top. That’s expected. What you’re looking for is
anything unexpected sitting high — large plan cache entries, ad-hoc query bloat, or
in-memory OLTP objects consuming more than you’d expect.
Queries with the largest memory grants
-- Top queries by memory grant
SELECT TOP 20
    qs.total_grant_kb / 1024 AS total_grant_mb,
    qs.max_grant_kb / 1024 AS max_grant_mb,
    qs.execution_count,
    qs.total_grant_kb / NULLIF(qs.execution_count, 0) / 1024 AS avg_grant_mb,
    SUBSTRING(
        st.text,
        (qs.statement_start_offset / 2) + 1,
        ((CASE qs.statement_end_offset
            WHEN -1 THEN DATALENGTH(st.text)
            ELSE qs.statement_end_offset
          END - qs.statement_start_offset) / 2) + 1
    ) AS query_text
FROM sys.dm_exec_query_stats qs
CROSS APPLY sys.dm_exec_sql_text(qs.sql_handle) st
WHERE qs.total_grant_kb > 0
ORDER BY qs.total_grant_kb DESC;SQL
Oversized grants are usually poor cardinality estimates — the engine thinks it needs more memory than it does because statistics are stale or the query is complex enough that estimates go wrong.
Check for spills to TempDB
-- Queries with spills to TempDB
SELECT TOP 20
    qs.execution_count,
    qs.total_spills / qs.execution_count AS avg_spills,
    qs.total_spills,
    qs.total_grant_kb / 1024 AS total_grant_mb,
    SUBSTRING(
        st.text,
        (qs.statement_start_offset / 2) + 1,
        ((CASE qs.statement_end_offset
            WHEN -1 THEN DATALENGTH(st.text)
            ELSE qs.statement_end_offset
          END - qs.statement_start_offset) / 2) + 1
    ) AS query_text
FROM sys.dm_exec_query_stats qs
CROSS APPLY sys.dm_exec_sql_text(qs.sql_handle) st
WHERE qs.total_spills > 0
ORDER BY qs.total_spills DESC;SQL
Internal vs external pressure
These are two different problems and should be treated separately.
Internal pressure is when SQL Server is the problem — queries requesting more memory than is available, plan cache bloat eating into the buffer pool, or a max server memory setting that’s too generous and starving other processes on the box.
External pressure is when something outside SQL Server is taking memory away from it — another application, the OS, or a misconfigured setting. This is where you see paging warnings in the error log and PLE dropping suddenly without any obvious query-level cause.
-- Check available OS memory vs what SQL is using
SELECT
    physical_memory_in_use_kb / 1024 AS sql_memory_used_mb,
    page_fault_count,
    memory_utilization_percentage
FROM sys.dm_os_process_memory;

-- Available system memory
SELECT
    total_physical_memory_kb / 1024 AS total_ram_mb,
    available_physical_memory_kb / 1024 AS available_ram_mb,
    system_memory_state_desc
FROM sys.dm_os_sys_memory;SQL
If system_memory_state_desc is anything other than “Available physical memory is high”,
the OS is already under pressure. At that point the conversation moves beyond SQL Server —
what else is running on this box?
What to actually do about it
1. Check max server memory first
SQL Server defaults to a max server memory of 2,147,483,647 MB — effectively unlimited. On a shared server, this will starve the OS and everything else running on it. It’s the most common fix and the most commonly overlooked setting.
A reasonable starting point is to leave 10% of RAM or 4GB for the OS (whichever is larger), and give the rest to SQL Server. On a dedicated box with 64GB RAM, somewhere between 56–58GB is sensible.
-- Check current setting
SELECT name, value_in_use
FROM sys.configurations
WHERE name = 'max server memory (MB)';

-- Set it (adjust the value to suit your server)
EXEC sp_configure 'max server memory (MB)', 57344; -- example: 56GB
RECONFIGURE;SQL
This takes effect immediately — no restart needed.
2. Deal with plan cache bloat
Ad-hoc queries each get their own plan cache entry. On a busy system this can add up to gigabytes of single-use plans eating into memory that could be used for data pages.
-- How much memory is the plan cache using, and how much is single-use?
SELECT
    objtype,
    COUNT(*) AS plan_count,
    SUM(size_in_bytes) / 1024 / 1024 AS total_mb,
    SUM(CASE WHEN usecounts = 1 THEN size_in_bytes ELSE 0 END) / 1024 / 1024 AS single_use_mb
FROM sys.dm_exec_cached_plans
GROUP BY objtype
ORDER BY total_mb DESC;SQL
If single-use ad-hoc plans are consuming significant memory, enable Optimize for Ad Hoc Workloads. It stores only a stub the first time a plan is compiled, and only caches the full plan if it’s used again. It doesn’t fix the underlying parameterisation problem, but it significantly reduces cache bloat.
EXEC sp_configure 'optimize for ad hoc workloads', 1;
RECONFIGURE;SQL
3. Fix queries with bad memory grants
If you found queries with oversized grants or spills earlier, those need attention. The usual causes are stale statistics and parameter sniffing — both worth their own posts. The quick check is statistics age on the tables involved:
-- Check statistics age on a table
SELECT
    OBJECT_NAME(s.object_id) AS table_name,
    s.name AS stat_name,
    sp.last_updated,
    sp.rows,
    sp.rows_sampled,
    sp.modification_counter
FROM sys.stats s
CROSS APPLY sys.dm_db_stats_properties(s.object_id, s.stats_id) sp
WHERE OBJECT_NAME(s.object_id) = '<replace with your table name>'
ORDER BY sp.last_updated ASC;SQL
Updating stats on the worst offending tables is often enough to bring oversized grants back to reality.
What not to do
Restarting SQL Server to free up memory doesn’t fix anything. The buffer pool fills back up — you’ve just cleared the cache and made the first hour of queries slower while it rebuilds.
Be careful with DBCC FREEPROCCACHE in production. Every query recompiles on next
execution, and on a busy system the resulting CPU spike can be worse than the original
memory problem. If you need to remove a specific plan, do it by plan handle.
More RAM will sometimes mask the problem rather than solve it. A query with a genuine memory grant issue will just request a bigger grant on a bigger server. You’ve deferred the problem, not solved it.
Where to start
Work through the diagnosis in order. Nine times out of ten the problem is max server memory not being set, plan cache bloat, or a handful of queries with poor cardinality estimates driving oversized grants.
The tenth time it’s something genuinely unusual — but by the time you’ve worked through the above you’ll have enough data to figure out what it is.